Readers' statistics
Find out how you can view and analyze your reader's statistics.
Overview
Tracking reader engagement in Flipsnack provides valuable insights into content performance, audience behavior, and lead generation. With Reader Statistics, you can monitor individual reader activity, measure engagement levels, and optimize your digital publications for better business outcomes.
Table of contents:
Enable reader tracking
Enable reader tracking
If you don’t have this option activated in your account and would like to know more about it, make sure you check out our article about Workspace readers. Before moving on, a quick mention: as per a recent update, the documents shared with readers have a different URL than those with visibility set to public. They now open in the app, and the readers need to log in in order to access them. This change also applies to the documents shared before the update. If a document was shared before the update, the old URL redirects to the new one.
Readers statistics will only show results for readers you have in your workspace and not for everyone who reads your publication.
However, if you’re interested in general statistics, find out everything you need to know about Flipsnack statistics.
Requirements
Plan: Enterprise.
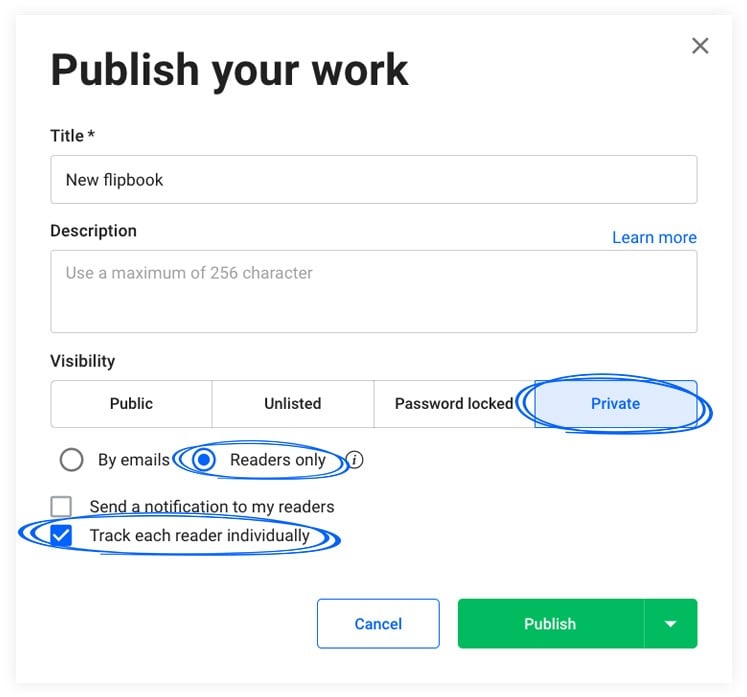
Track each reader
In order to see Readers statistics, make sure you first check “Track each reader individually". If you don't do this, then you'll have no statistics here. You can also “Send a notification to my readers" to inform them about your publication.
Access readers statistics
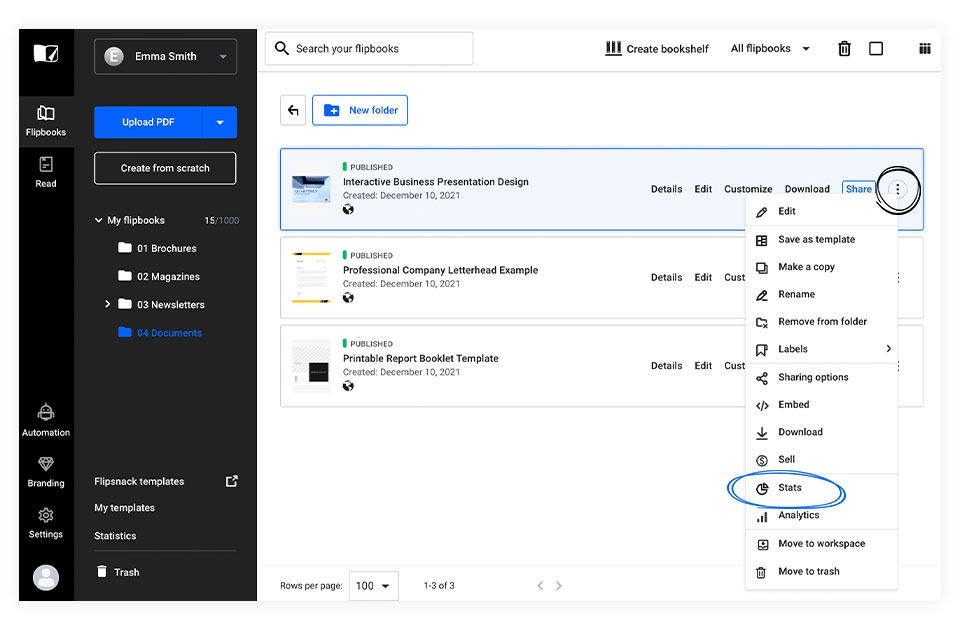
So to access Readers statistics, just log into Flipsnack, then go to My flipbook and select the flipbook you want to see the statistics for. Click on the three dots and select Stats. If you don't see that option it's because your flipbook wasn't published. To share a flipbook and collect data about it, you need to publish it first.
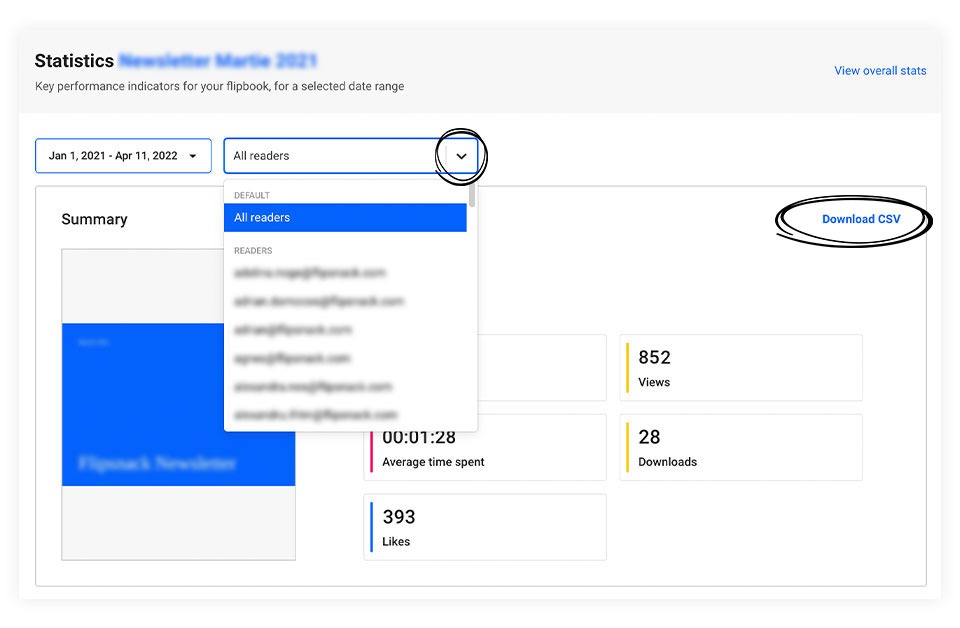
The Summary is the first section you’ll see. Here you have all the important information including impressions, views, average time spent, and downloads.
You can select the date and view the overall summary of all the readers. But you can also select each reader individually to see a specific summary of their statistics. You can download the CSV file for all the readers or each one separately.
Important: All Flipsnack statistics are presented following the UTC timezone.
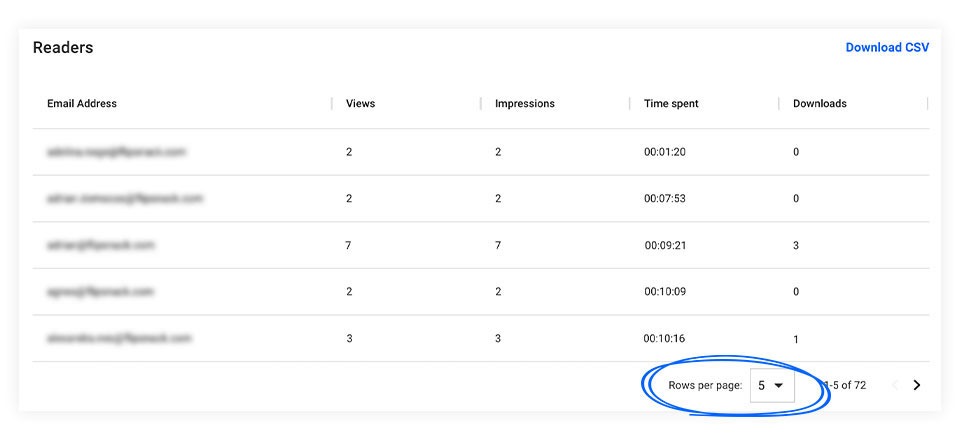
In the Readers section, you have a more detailed view of each reader individually, like the ones already mentioned: views, impressions, time spent, and downloads. You can also select the number of rows you want to see per page.
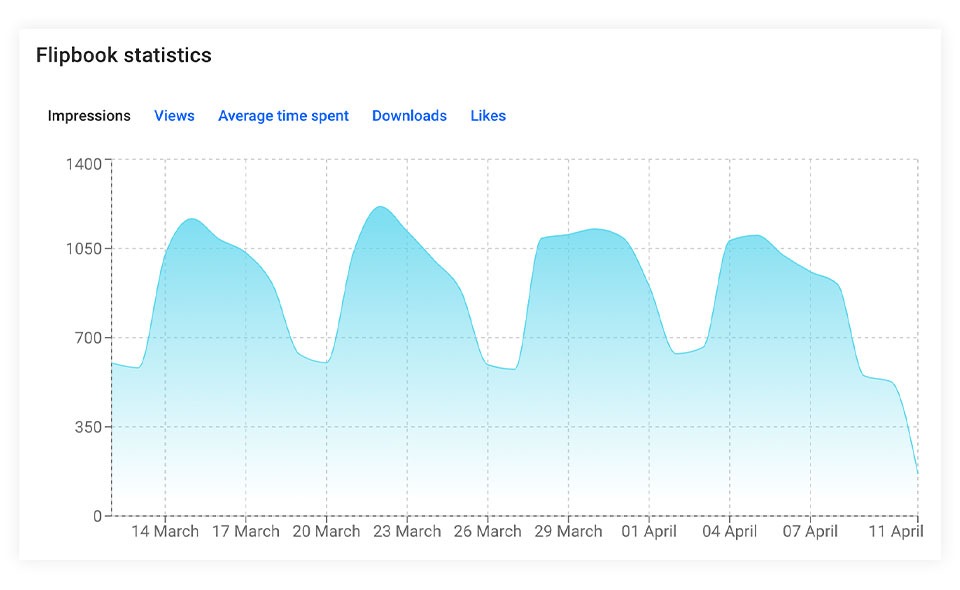
Below, there is an interactive chart that graphically represents all the stats that we’ve talked about. Click on the chart and see all the interactivity on each day.
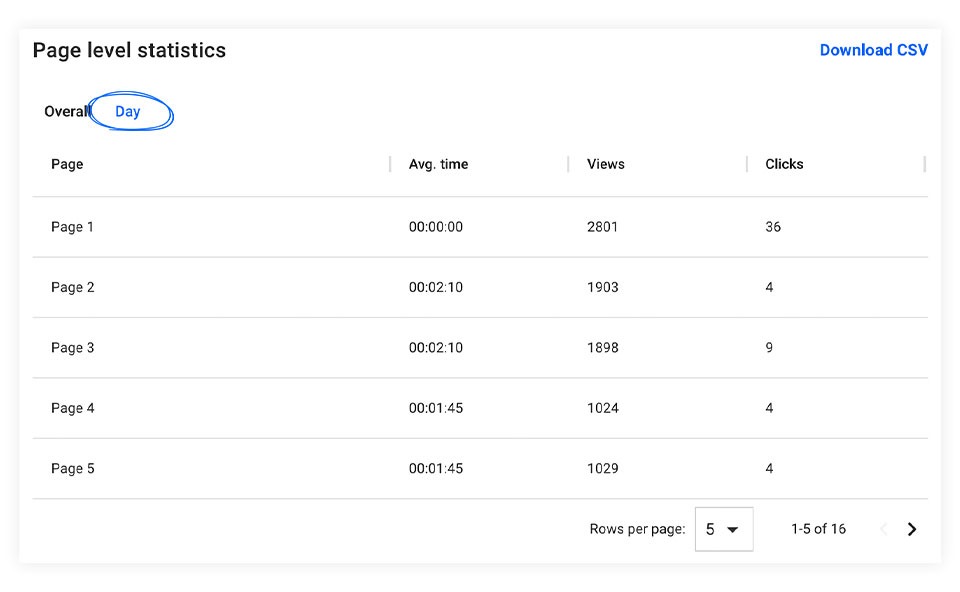
Page-level statistics
Page-level statistics give you an overall view of all your flipbook pages. For each page, you can see the average time spent, views, and clicks. If you want to watch your flipbook performance day by day, you can simply select “Day".
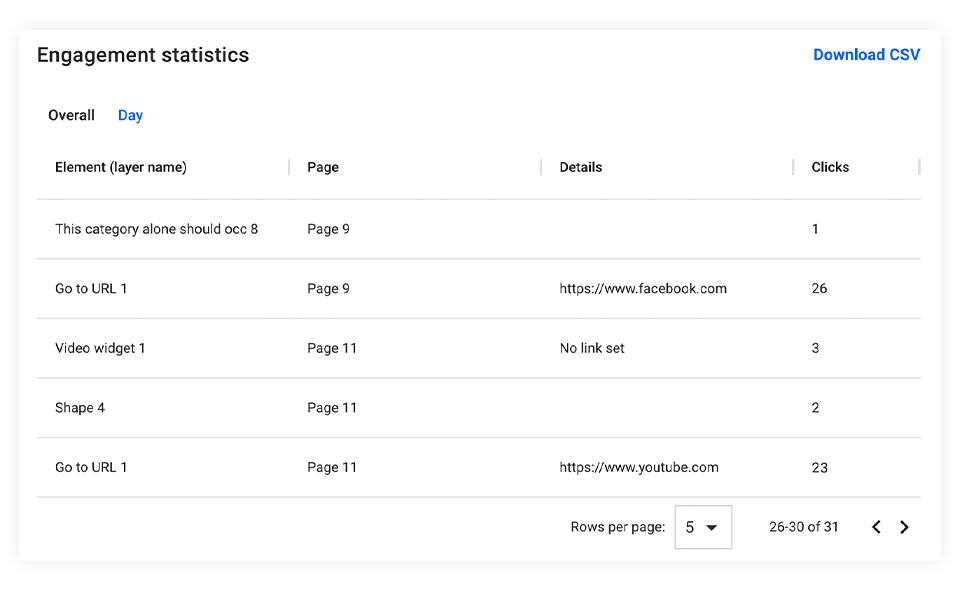
Another great section is the Engagement statistics. If you have elements in your flipbooks like images, audio, videos, links, social media buttons, etc., here you can see how your readers interacted with them by viewing how many times they’ve clicked on them.
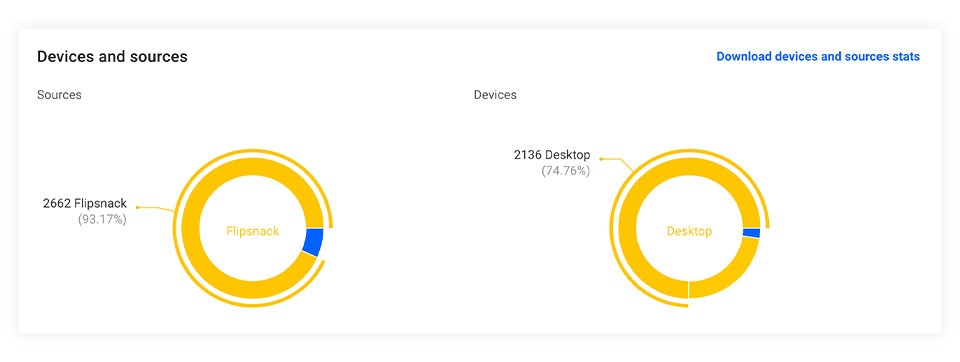
Flipsnack statistics also lets you view the devices and sources through which your readers had access to your flipbook, such as mobile phones, tablets, or desktops.
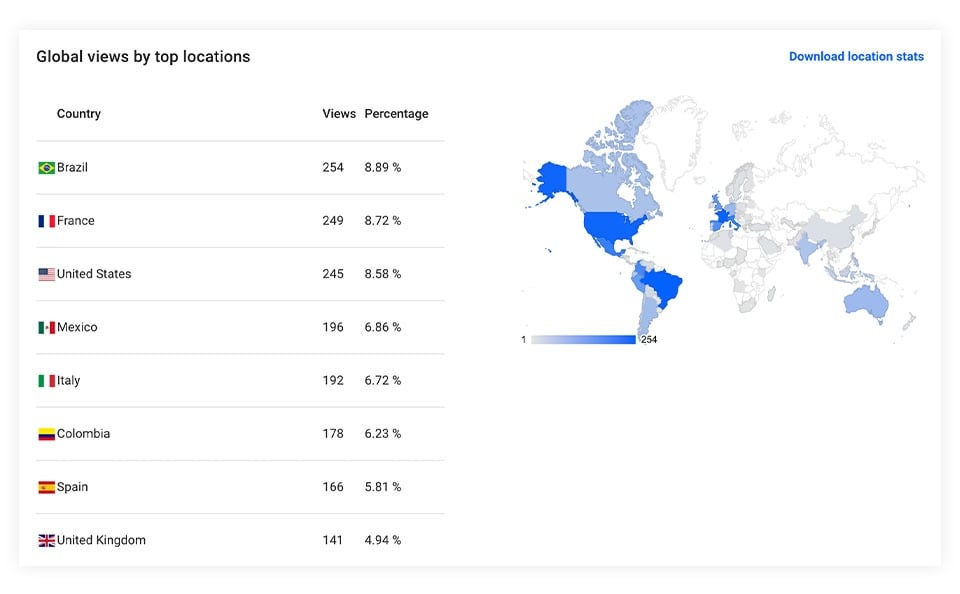
Global views by top locations allow you to see where your readers accessed your flipbooks from. You even have an interactive map where you can click on different regions.
In case you have lead forms in your flipbooks, you’ll see each reader that filled it in.
You can get in touch with an account manager if you're interested in using this within your organization.
Next Steps
Useful resources
Maximize your workspace efficiency with our complementary guides, everything you need to scale your content operations effectively:
Permission controls for team management
Shopping list order statistics
Individual trackable links for your publications
Need expert support?
Our team is here to help. Connect with our team experts or message us via the in-app chat for personalized assistance.