Overview
Flipsnack Analytics helps you understand how your digital publications perform by tracking reader engagement and behavior. With redesigned dashboards, AI-driven insights, and interactive heatmaps, you can turn raw numbers into actionable strategies. Whether you’re managing a team or running campaigns, Flipsnack Analytics gives you the clarity to make informed decisions.
Note: If you're searching for the Page level and Engagements statistics (previously available under the old Stats button), these have been moved to Heatmaps – Data mode.
Requirements:
- Plan: Professional or higher.
- Heatmaps: available only with the Enterprise plan.
- All features are available during the 14-days free trial.
Table of contents:
- For workspace-wide data: Access from My flipbooks page
- For flipbook-level data: Use the Analytics button (ex-Stats)
Key benefits
-
Workspace-wide insights: Monitor engagement across all flipbooks in one place.
-
Behavior analysis: Track reader actions at workspace, flipbook, bookshelf, and page level.
-
Interaction tracking: See how readers engage with links, videos, forms, and other elements.
-
Visual engagement tools: Use heatmaps to understand where attention goes.
-
Advanced reporting: Integrate Google Analytics for deeper insights.
Accessing analytics
Note: Learn more about Flisnack Analytics from our Academy Lessons.
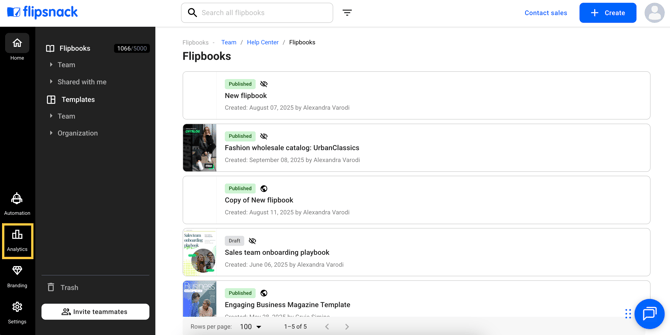
For workspace-wide data: Access from My flipbooks page
-
Go to My flipbooks.
-
Click the Analytics button above your account’s Settings.
-
The dashboard will open with workspace-wide data.
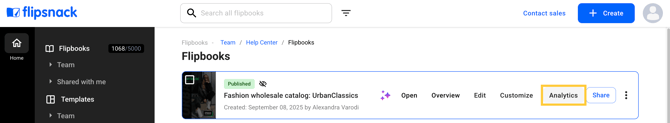
For flipbook-level data: Use the Analytics button (ex-Stats button)
Note: This replaces the former Statistics page, which used to display flipbook performance.
- Go to My flipbooks.
- Select the flipbook you're interested in.
- Click on the Analytics button.
- A dashboard will open showing data only for that flipbook.
When you open Analytics, you’ll see an overview of how your flipbook is performing. The available insights include:
-
AI insights (NEW) – Key takeaways about reader behavior.
-
Location – See where your readers are located.
-
Sources – Find out how readers accessed your flipbook.
These stats and options will be explained in detail in the following sections.
The general Dashboard
The dashboard gives you a snapshot of performance across your workspace. These statistics will inform you how your flipbooks perform together as a group.
By default, data from the last 30 days is shown (UTC timezone). You can change the date range at any time.
Stats and reports included: Overview, Insights, Heatmap, Location & Sources – they will all be presented in detail in the following section about Performance reports.
Note: You can filter statistics only for the last 5 years. Data before 2020 is not available right now, but we plan to make it available in the future.
Performance reports
Now that you’ve seen the overall dashboard view, let’s dive deeper into each section of Performance reports to understand what the numbers mean and how to use them effectively.
Overview
The Overview section gives you a high-level summary of your flipbooks’ performance across the selected date range. It combines both a quick metrics panel and a timeline chart.
Metrics displayed include:
-
Views – Every time someone interacts with your flipbook or spends more than 5 seconds.
-
Impressions – Every time a flipbook is loaded through its link or embed.
-
Clicks – Total number of clicks on interactive elements.
-
Average time spent – The average time readers spend engaging with your flipbooks. After 30 minutes, Flipsnack stops counting the minutes spent if the flipbook remains open, in order to provide a higher level of accuracy.
-
Downloads – How many times your flipbooks were downloaded in PDF format (if enabled).
Below the timeline, you’ll also find the Flipbooks overview section. This shows all the flipbooks in your workspace. You can use the arrows to rearrange them and compare views, clicks, and time spent on each page.
Note: You can download flipbook overviews and page-level statistics as a CSV file to track and share insights with your team. Available from the Professional plan.
NEW: Insights
The Insights section uses AI to automatically generate reports that summarize reader engagement and performance. It highlights key statistics and trends, helping you quickly understand how your flipbooks are performing - without manually analyzing the data.
-
Select the date range you want.
-
Click the Get insights button next to the flipbook.
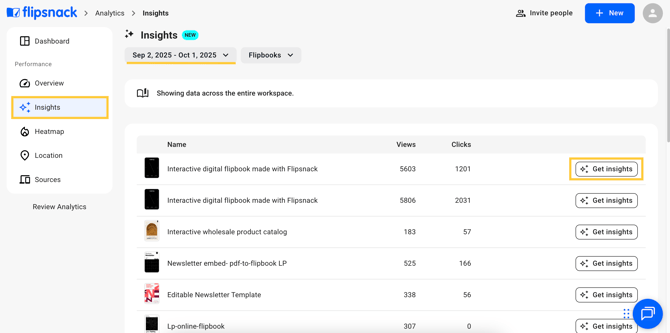
Each time you request insights, 5 AI credits will be used from your account. The report will give you detailed insights for that specific flipbook.
Each Insights report includes:
-
Summary – A narrative overview of impressions, views, clicks, time spent, and downloads.
-
Interpretation – AI-generated insights that explain what the numbers mean.
-
Recommendations – Suggestions to help increase impressions, views, or reader interaction.
You can regenerate the report if needed, and each report is tied to the selected flipbook and date range.
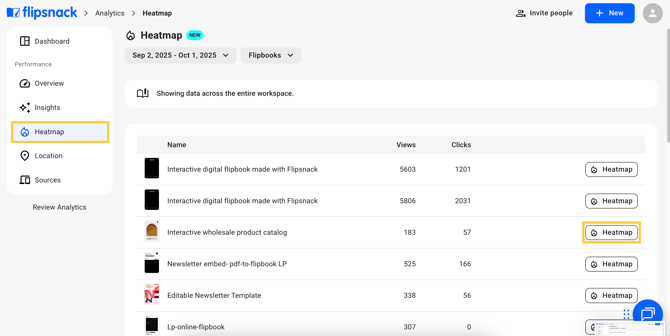
NEW: Heatmaps
Heatmaps in Flipsnack don’t show exact click locations. Instead, they highlight clicks on interactive elements only (like buttons, links, videos). This helps you understand what attracts attention and what elements drive engagement.
Important: Heatmaps are available with the Enterprise plan, but the Data mode will remain available starting from the Professional plan.
Click on Heatmap button to see what readers click the most on a specific flipbook.
Heatmaps are displayed in two modes:
-
Visual mode – Overlays color gradients directly on flipbook pages. Warmer colors (red, orange, yellow) indicate high interaction areas, while cooler colors (blue, green) represent fewer clicks.
-
Data mode – shows a breakdown of all interactive elements in your flipbook pages and how readers engaged with them.
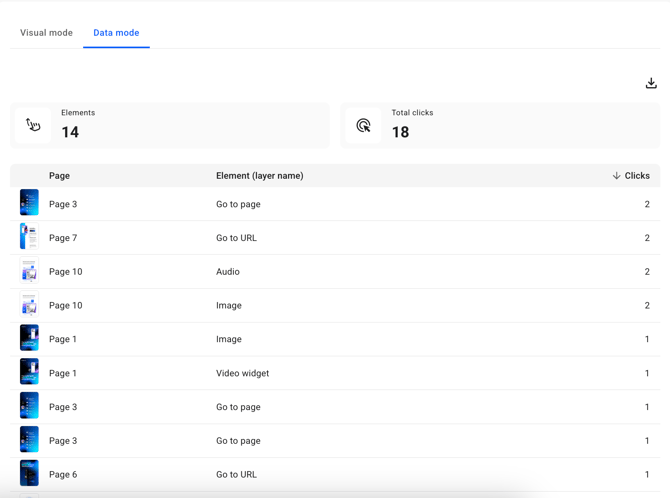
Note: The colors are based on how many clicks each element gets across the entire flipbook, not just the page you're viewing. This means the “hot” (red) and “cool” (blue) colors show which elements got the most or fewest clicks overall, not per page.
Location
The Location section provides a geographic breakdown of where your readers are coming from. It helps you identify the countries where your flipbooks are most popular and track engagement across different regions.
Features include:
-
Interactive world map – Displays viewer distribution visually, with markers indicating reader locations.
-
Country list – Shows the number of views and the percentage share for each country. This list can be sorted by views or percentage.
This information is useful for tailoring content strategies based on regional interest and for demonstrating reach in specific markets.
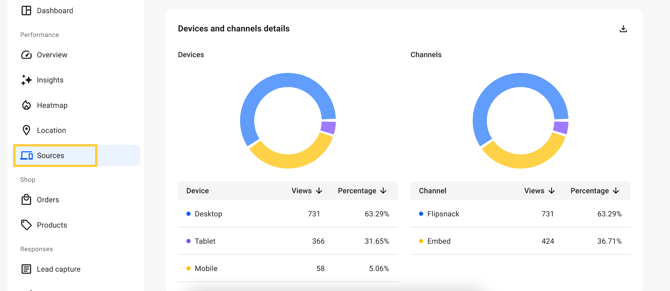
Sources
The Sources section helps you understand how readers are accessing your flipbooks and which devices they use. It contains two key reports:
-
Devices – Breaks down views by desktop, tablet, or mobile, showing percentages and totals. This helps you optimize your flipbooks for the platforms your audience prefers.
-
Channels – Shows whether readers opened your flipbook directly through a Flipsnack link, or via an embed on another website. This provides insight into distribution performance.
Together, these reports reveal not only where your audience comes from but also how they prefer to consume your content.
Shopping stats
If you use shopping lists in your catalogs, Flipsnack Analytics tracks related activity. You can access these stats from the Analytics button of every flipbook.
Orders
The Orders section provides detailed insights into purchases made through flipbooks with shopping lists enabled. It allows you to track revenue, monitor order activity, and manage entries.
Features include:
-
Revenue and Orders overview – Displays total revenue and number of orders within the selected date range, along with a timeline chart to visualize order trends over time.
-
Orders details table – Lists all individual orders with the following data:
-
Order ID
-
Buyer’s email
-
Order date and time
-
Order value (with currency support)
-
Checkout method (Slack, email, WhatsApp)
-
Actions (view, download, delete)
-
-
Management options – You can delete test or duplicate orders, or download details for reporting.
-
Export option – You can currently export orders one by one as CSV files, or you can export the full list of orders in a single CSV file.
This section is particularly valuable for sales and marketing teams who need to measure catalog performance and revenue impact.
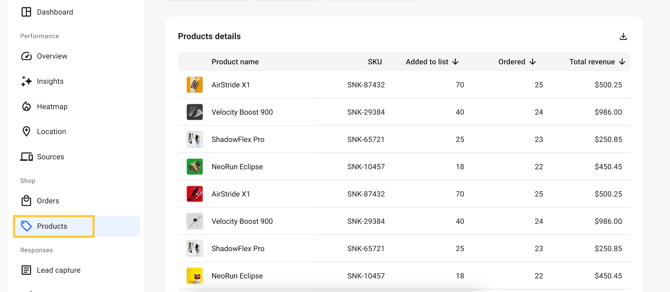
Products
The Products section shows product-level insights from catalogs with shopping lists enabled. It highlights how each product performs in terms of customer interest and sales.
Features include:
-
Product details table – Lists each product with:
-
Product name and SKU
-
Number of times it was added to the list
-
Number of times it was actually ordered
-
Total revenue generated
-
-
Sorting options – You can arrange the table by order or total revenue to quickly see which products drive the most sales and revenue.
-
Export option – Download the full product list for reporting or further analysis.
Note: For accurate tracking, each product must have a unique SKU. If a product doesn’t have a unique SKU (for example, if only a name and price were added), Flipsnack can’t identify it correctly. This may affect how the product appears in the list, and the order of most viewed or ordered items may not be accurate.
This view and arrows help identify popular items, customer preferences, and products that generate the highest ROI.
Responses stats
If you add interactive forms to your flipbooks - such as lead capture, quizzes, questions, or contact forms - Flipsnack Analytics collects and organizes all responses here. This section helps you measure how readers interact with your forms, understand engagement levels, and export valuable data for follow-up or CRM integration.
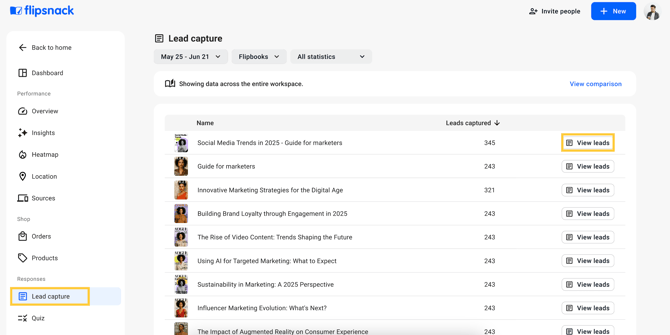
Lead capture
The Lead capture section tracks how many people filled out your lead forms across flipbooks. This helps you measure audience interest and collect valuable contact information.
Features include:
-
Leads overview – Displays the total number of leads captured from each flipbook.
-
Leads details – A list of all captured leads, including contact information submitted through the form.
This section is essential for marketing teams who want to evaluate campaign performance and follow up with potential customers.
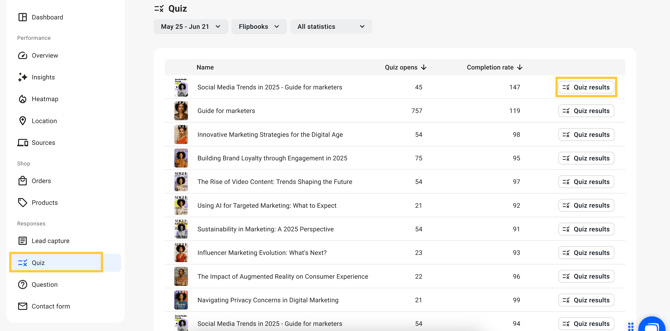
Quiz
The Quiz section collects and displays results from quizzes embedded in your flipbooks. It helps you track participation, completion, and performance.
Features include:
-
Quiz summary – Shows the number of quiz opens and completion rate.
-
Quiz results – Lists with details about the questions and the number of correct answers.
This data is useful for educational use cases, training materials, or marketing campaigns where engagement and knowledge retention are key.
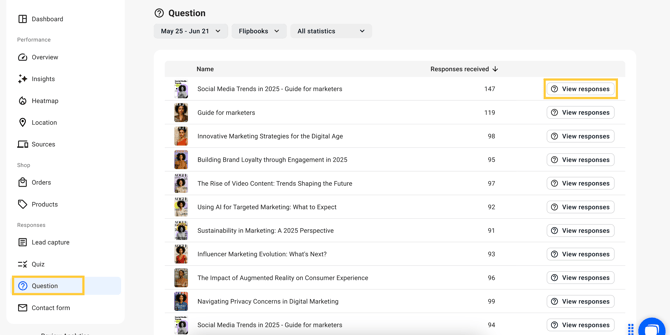
Question
The Question section gathers responses from custom questions you add to your flipbooks. It allows you to measure reader input and feedback on a specific prompt.
Features include:
-
Responses received – Shows the total number of answers submitted for a given question.
-
View responses – Lists the answers to the questions used in a specific flipbook.
This section is especially useful for gathering targeted feedback directly from your readers.
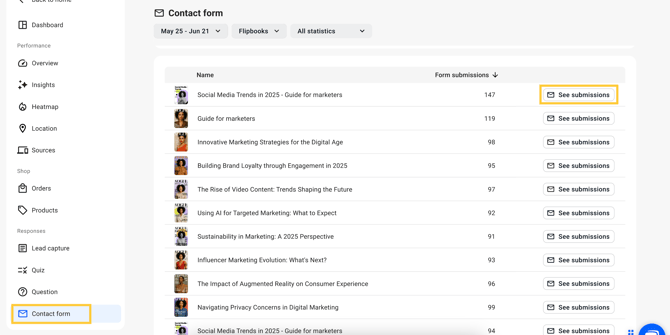
Contact form
The Contact form section tracks submissions from contact forms added to your flipbooks. It shows how many readers used the form to reach out and provides access to their messages.
Features include:
-
Form submissions – Displays the total number of contact form entries.
-
See submissions – Access submitted information such as names, emails, and messages.
This section is especially useful for customer support, sales inquiries, or gathering general feedback directly from your readers.
Google Analytics
Besides keeping track of integrated statistics, you also have the option to integrate Google Analytics on your profile or with specific flipbooks.
If you already use Google Analytics tracking, you will see some differences between the GA reports and Flipsnack statistics. These can easily be explained. We're talking about two independent tracking systems that interpret the data differently. View means something in GA and something a little different in Flipsnack.
Your GA filters could also filter some data out of the report. However, the difference between Flipsnack views and GA impressions shouldn't be sky-high. If it is, I'd first look at the selected report dates in both tools to ensure we're looking at the same date range and then investigate further.
Keep in mind that most reports can also be downloaded.
Next steps
Useful resources
Transform your analytics strategy with our comprehensive guides on performance tracking and optimization:
- Readers' statistics
- Bookshelf statistics
- Google Analytics integration
- Workspace and shopping list order statistics
Need expert support?
Our team is here to help. Connect with our team experts or message us via the in-app chat for personalized assistance.