You get a lot of information about how your Flipsnack catalogs are performing from our statistics reports. However, when integrating Google Analytics, you can access more granular data to explore.
Table of contents:
- Reports snapshot
- Realtime reports
- Acquisition reports
- Engagement reports
- Flipbook page number report
- Monetization reports
- Retention reports
- Demographics reports
- Tech reports
What data can you track through Google Analytics 4?
Google Analytics 4 (GA4) is the latest version of Google's web analytics tool that helps you measure and understand your flipbooks' performance. GA4 uses an event-based model to track your data, which means that any interaction that a user has with your content can be captured as an event. GA4 also offers more features, such as cross-platform tracking, predictive analytics, and enhanced privacy controls.
If you want to use GA4 for your Flipsnack catalogs, you will need to create a new property in Google Analytics and link it to your Flipsnack account. By integrating GA4 with your Flipsnack catalogs, you will be able to access a variety of reports that show you how users interact with your content and how well you achieve your business goals.
To access the reports, log in to your Google Analytics account and select the property that you created for your Flipsnack catalogs. Then navigate to the Reports section on the left sidebar and explore the different categories of reports available. You can also use filters, segments, dimensions, and metrics to customize your reports and get more insights into your data.
Warning: Please note that, with the exception of real-time reports and certain cards in the "Reports Snapshot" section, all other reports require 24 to 48 hours to aggregate data in GA4.
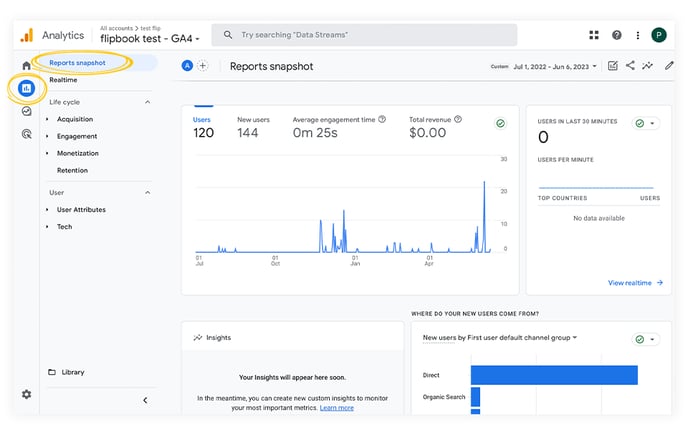
Reports snapshot
The Reports snapshot is the first thing you see when you open your GA4 reports tab. It gives you a quick overview of your key metrics, such as users, sessions, conversions, and retention. You can also see how your metrics change over time and compare them with different periods. The reports snapshot can be personalized according to your preferences by clicking on the Customize report on the top right side of the screen.
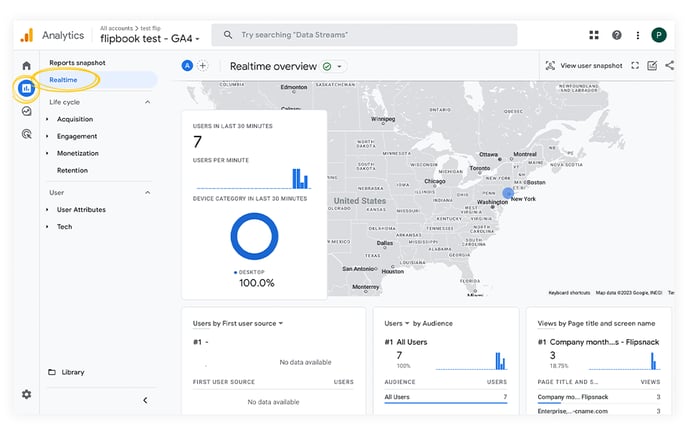
Realtime reports
Realtime reports show you how many users are viewing your flipbooks right now, where they are located, what traffic sources they came from, and what events they are triggering. You can use this report to monitor the immediate impact of your marketing campaigns or content updates. With the exception of real-time reports, for all the other reports, it takes 24-48 hours for Google Analytics to process your data.
Acquisition reports
The Acquisition reports shows you how users find your flipbooks and what channels drive them to your content. You can see the number of users, sessions, and conversions for each traffic source, such as organic or paid search, social media, email, or direct.
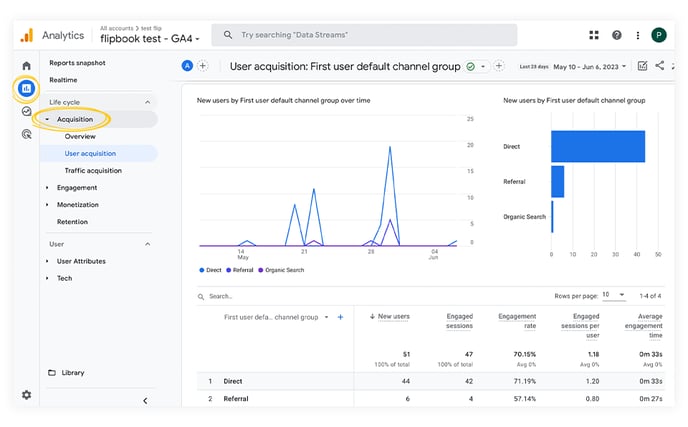
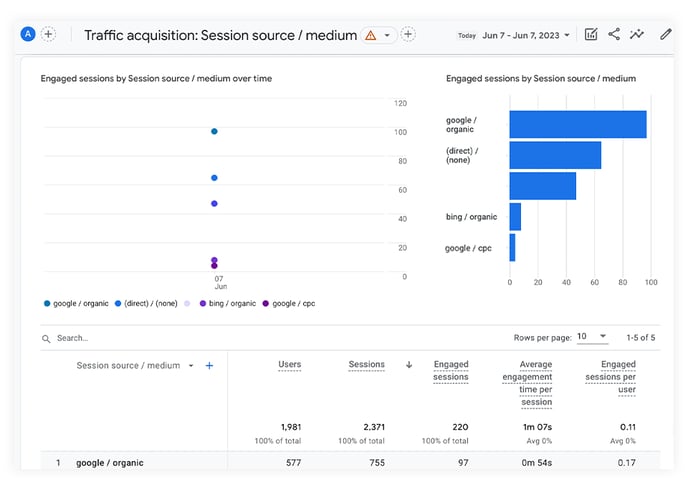
If you are using the flipbooks in campaigns and track them by UTM parameters in the URLs, you can also see more details and see the users or traffic acquisition by source, medium, and campaigns based on the UTMs, helping you determine which distribution channel works the best for you.
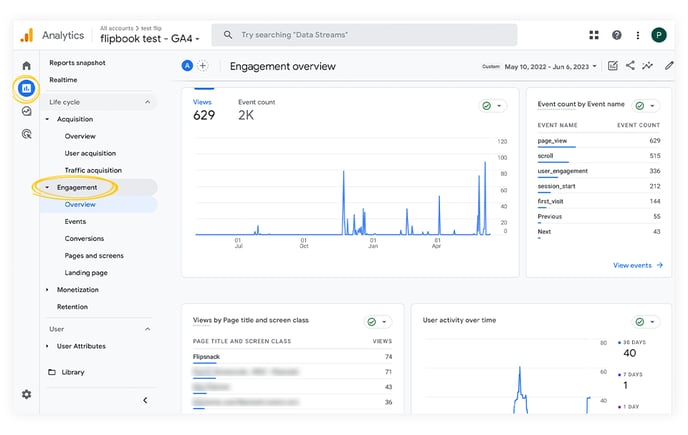
Engagement reports
The Engagement reports shows you how the users interact with your flipbooks and how engaged they are with your content. You can see metrics such as pages per session, average session duration, bounce rate, and engaged sessions. You can also see the name and the number of events triggered by users.
Note: Please be aware that engagement metrics related to page-level statistics are available exclusively for individual flipbooks. To access this data, make sure you have accurately added the tracking ID by following the guidelines provided in this help center article.
Here is a list of all the events that are tracked:
- Zoom – shows how many times readers zoomed in and out.
- Click – shows how many times readers clicked a hyperlink element that opened a URL.
- Next – shows how many times readers clicked next to view pages. The "next" event can be triggered by pressing the "right arrow" key on your keyboard, clicking or tapping the right arrow in the flipbook player, or dragging the pages from right to left.
- Previous – shows how many times readers clicked previous to view pages. The "previous" event can be triggered by pressing the "left arrow" key on your keyboard, clicking or tapping the left arrow in the flipbook player, or dragging the pages from left to right.
- Share options(learn more):
- Share with link – shows how many times readers clicked on the copy link button.
- Share with email – shows how many times readers clicked the Share with email button.
- Share with Facebook/LinkedIn/Pinterest/Twitter – shows how many times readers clicked on each individual social media sharing button. Each button is tracked as a separate event.
- Pages overview – shows how many times readers clicked the Pages overview button(learn more).
- Enter fullscreen – shows how many times readers entered fullscreen(learn more).
- Exit fullscreen – shows how many times readers exited fullscreen(learn more).
- Download PDF – shows how many times readers clicked the Download PDF option(learn more).
- Print PDF – shows how many times readers clicked the Print PDF option(learn more).
- Search – shows how many times readers clicked on the Search button(learn more).
- Sound on – shows how many times readers clicked on the Sound on button(learn more).
- Sound off – shows how many times readers clicked on the Sound off button(learn more).
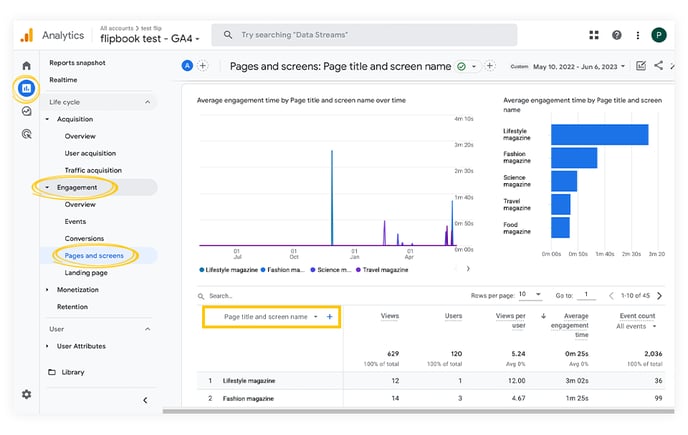
The default way this report displays your data is by “Page path and screen class,” and you have to select “Page title and screen class” in order to see the titles you have set for the flipbooks.
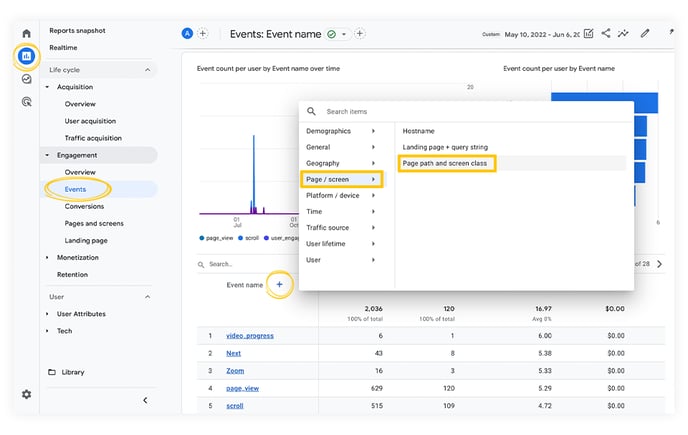
To see flipbook events, go to Engagement - Events. Here, by clicking on the + button, add another custom dimension named Page path and screen class. This way, you will see each event according to each flipbook URL.
Flipbook page number report
With each custom event named “Next” and “Previous”, there is a custom parameter called “label” that displays the page number where the event was triggered.
Warning: The 'Next' and 'Previous' events won't be registered in GA4 when using the scroll effect as a page transition effect. If this is something that concerns you, please contact us via live chat and provide us with more details about your use case.
To create the “label” custom parameter, go to Admin > scroll down to find the Data display card > and click on Custom definitions.

To create a custom dimension, click the Create Custom Dimension button located at the top right corner. Enter a descriptive name for the dimension and provide a helpful description. In the Event parameter field, type "label". Finally, click the "Save" button in the top right corner to apply your changes.

This parameter is visible in Realtime reports and under Engagement > Events.

Additionally, it can be utilized in Exploration Reports for deeper insights into user navigation patterns. Here's an example:

Monetization reports
If you have the purchase event set up on your website and use the same Google Analytics 4 property on your flipbooks, the Monetization report can show you how much revenue you generate from your flipbooks and how well you convert your users into customers. You can see metrics such as revenue, transactions, average order value, and conversion rate. You can also drill down into each event to see more details, such as items purchased or transaction ID.
Retention reports
After getting a lot of data, the Retention reports shows you how well you retain users over time and how loyal they are to your flipbooks. You can see metrics such as retention rate, churn rate, returning users, and new users. You can also see how different cohorts of users behave based on their first visit date or other criteria. You can also drill down into each cohort to see more details such as retention curve or user lifetime value.
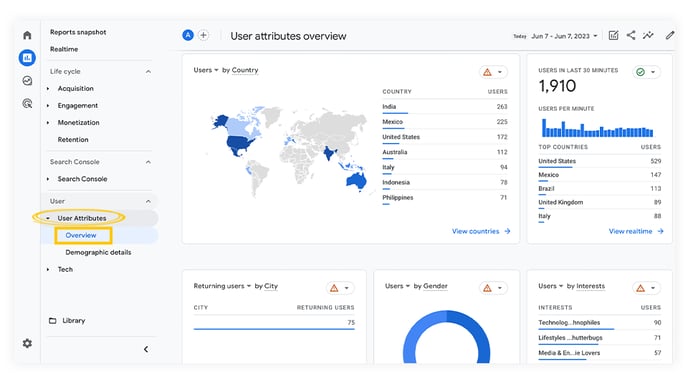
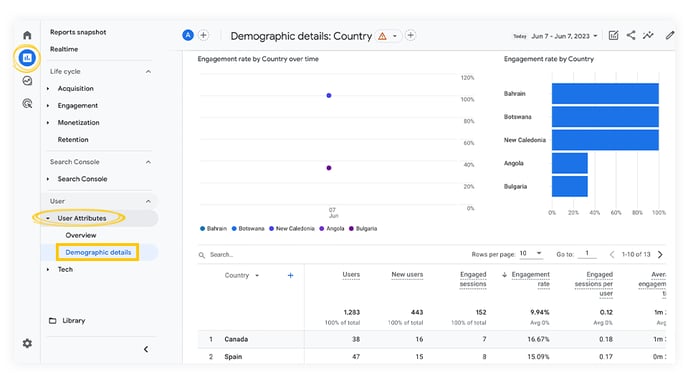
Demographics reports
The Demographics reports shows you more details about your users' characteristics and preferences, such as their age range, gender, interests, language, and location. You can see metrics such as users, sessions, revenue, and conversion rate for each demographic group.
Under Demographic details, you can see how different groups perform over time and compare them with each other. You also have the options to add different dimensions and also drill down into each group to see more details, such as events or conversions triggered.
Tech reports
The Tech reports shows you more details about your users' devices and technologies, such as their device category, operating system, browser, and screen resolution. You can see metrics such as users, sessions, revenue, and conversion rate for each tech group and also drill down into each group to see more details such as events triggered or user properties.
Interested in integrating Google Analytics for deeper insights? Check out our pricing plans.
If you have any questions or suggestions, please contact us via live chat.