
Overview
Combined analytics shows the statistics of several flipbooks in one report. Views, impressions, clicks, downloads and time spent are totaled across the flipbooks you select. Use it to see how a full campaign or collection performs, without opening each flipbook one by one.
Requirements
- Plan: Pro or above: check your plan or compare plans
- Business plan or higher for branding customization: compare plans
How to view combined analytics
- In the left sidebar, click Analytics.
- Click the Entire workspace filter.
- Move the pointer over a flipbook and select its checkbox. Do the same for each flipbook you want to add.
- Click Show combined.
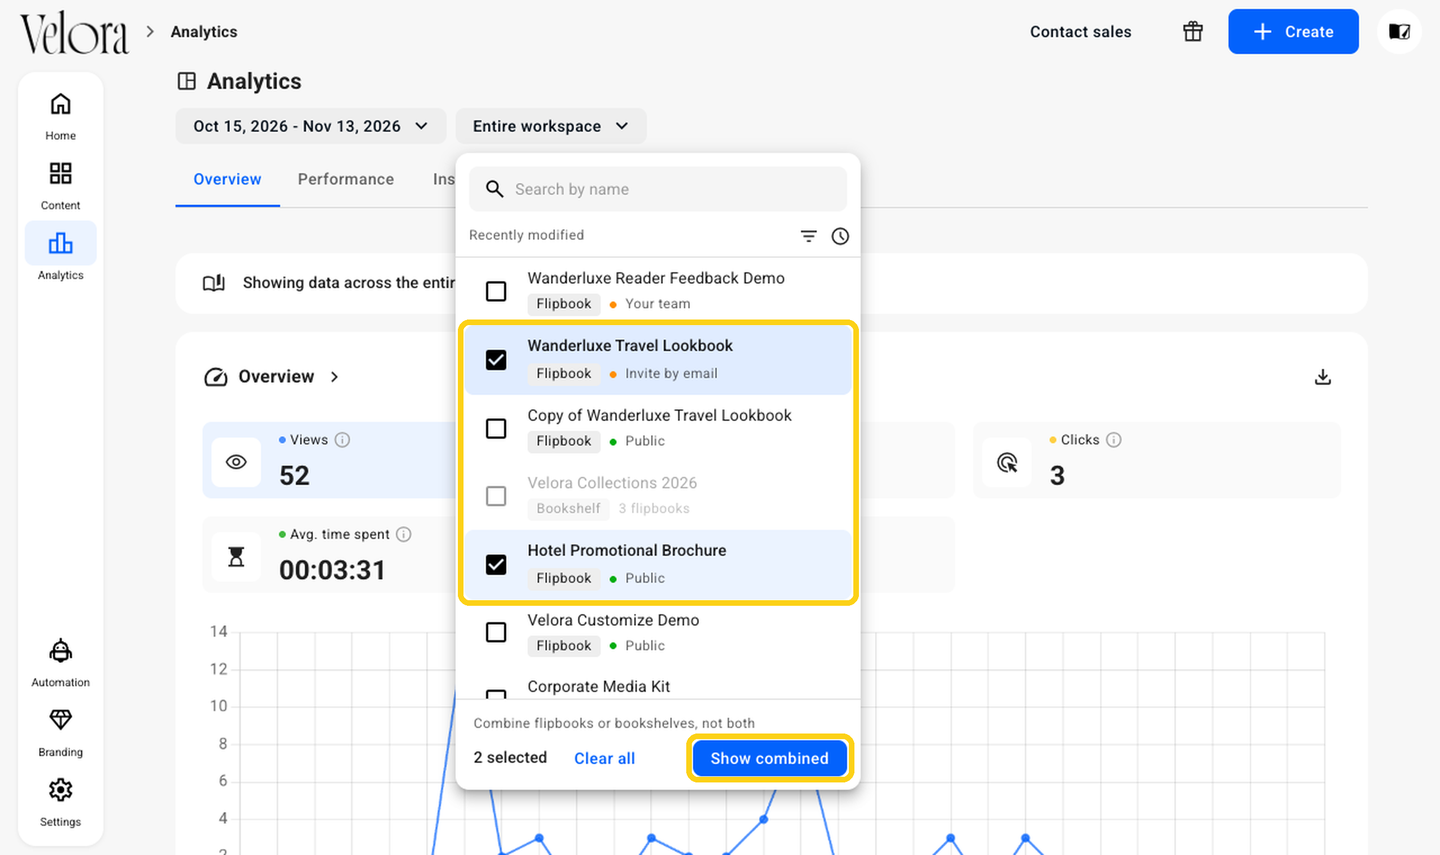
Note: Select the checkbox, not the flipbook name. A click on the name opens the statistics of that one flipbook only.
Read the combined report
The filter now shows the number of flipbooks, for example 2 flipbooks, and the report starts with 2 flipbooks combined. The totals in Overview and the other tabs are for all the selected flipbooks together.
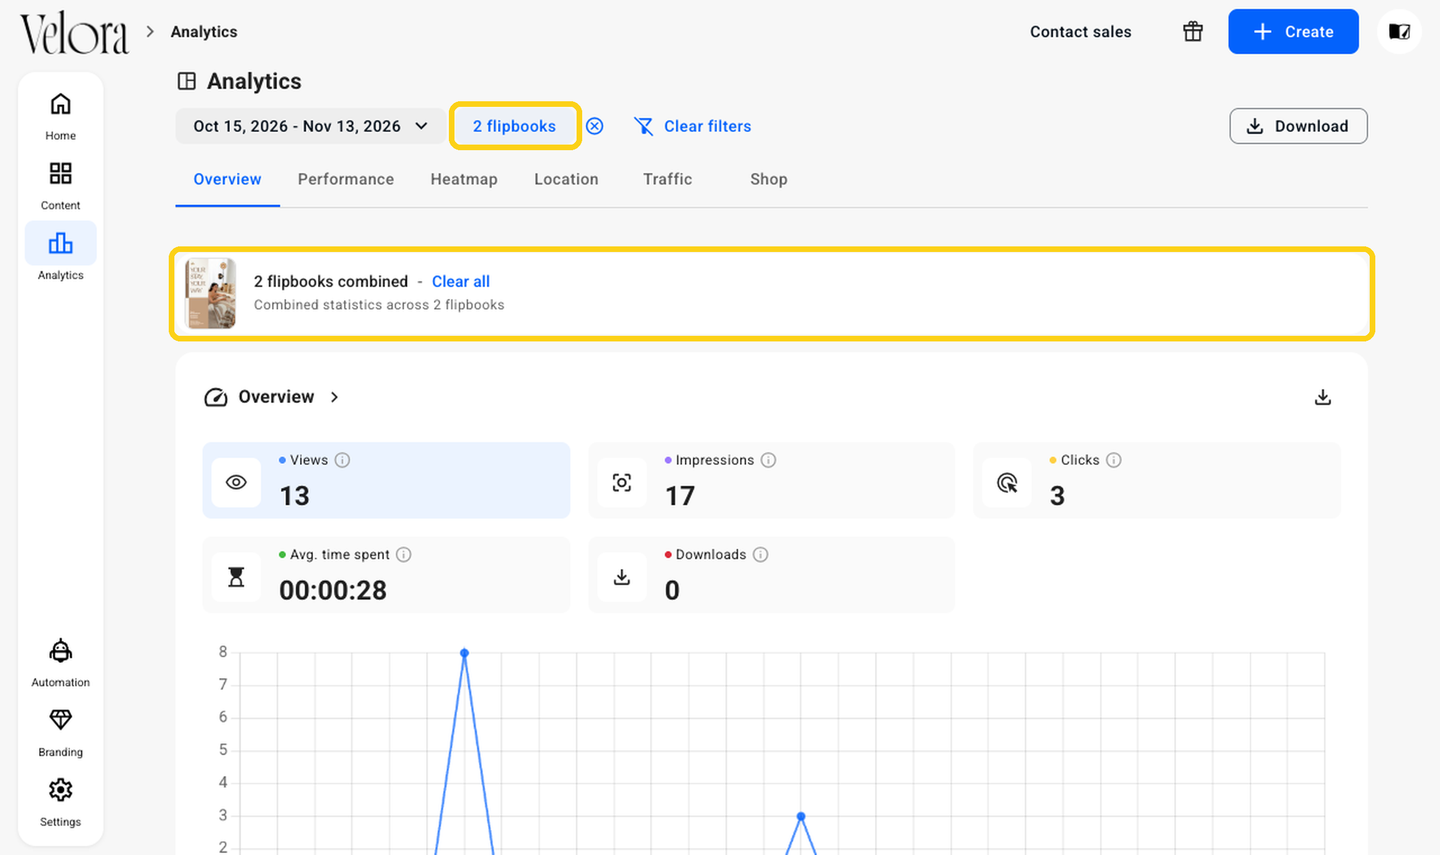
To change the date range, use the date filter next to it. To go back to the full workspace, click Clear all or Clear filters.
Good to know
- You can combine flipbooks or bookshelves, but not flipbooks and bookshelves together.
- The combined report has the tabs Overview, Performance, Heatmap, Location, Traffic and Shop.